0.1.76

Call the API. Then watch what it did.

Dispatch Studio is a desktop API workspace with a load tester and a JVM monitor in the same window. Scan a service, call it, put the calls in a suite and then under load — and switch to Observe to see the query it fired, the queue it published to, the log line it wrote and the object it left on the heap. A desktop agent does the steps no API reaches, and AI Ground answers questions about all of it with a model on your own computer.

Runs on your machine No account, no server, no sync Watches Java 8 and up
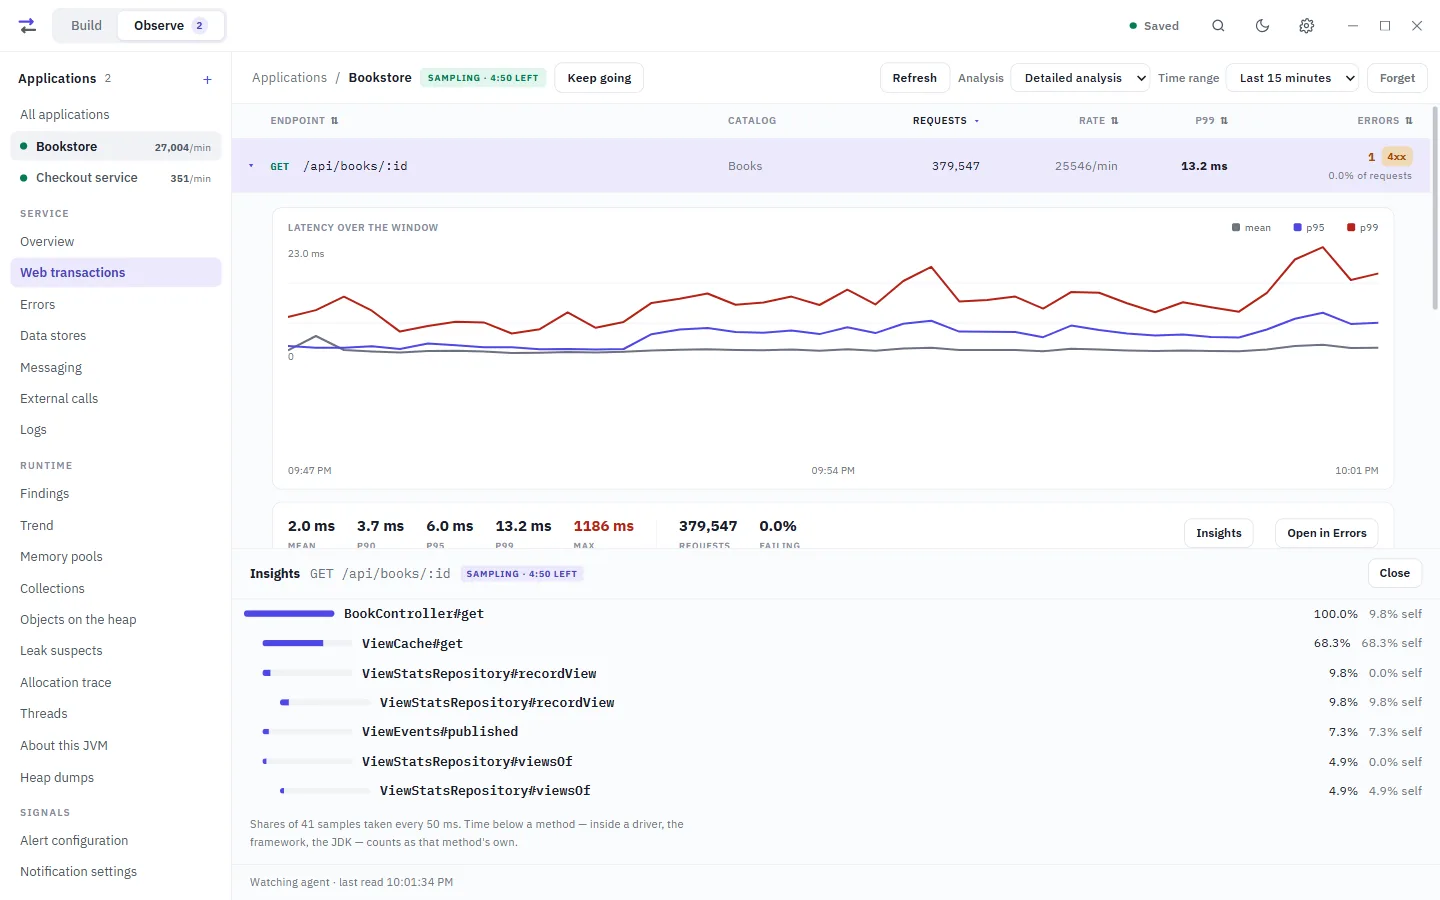
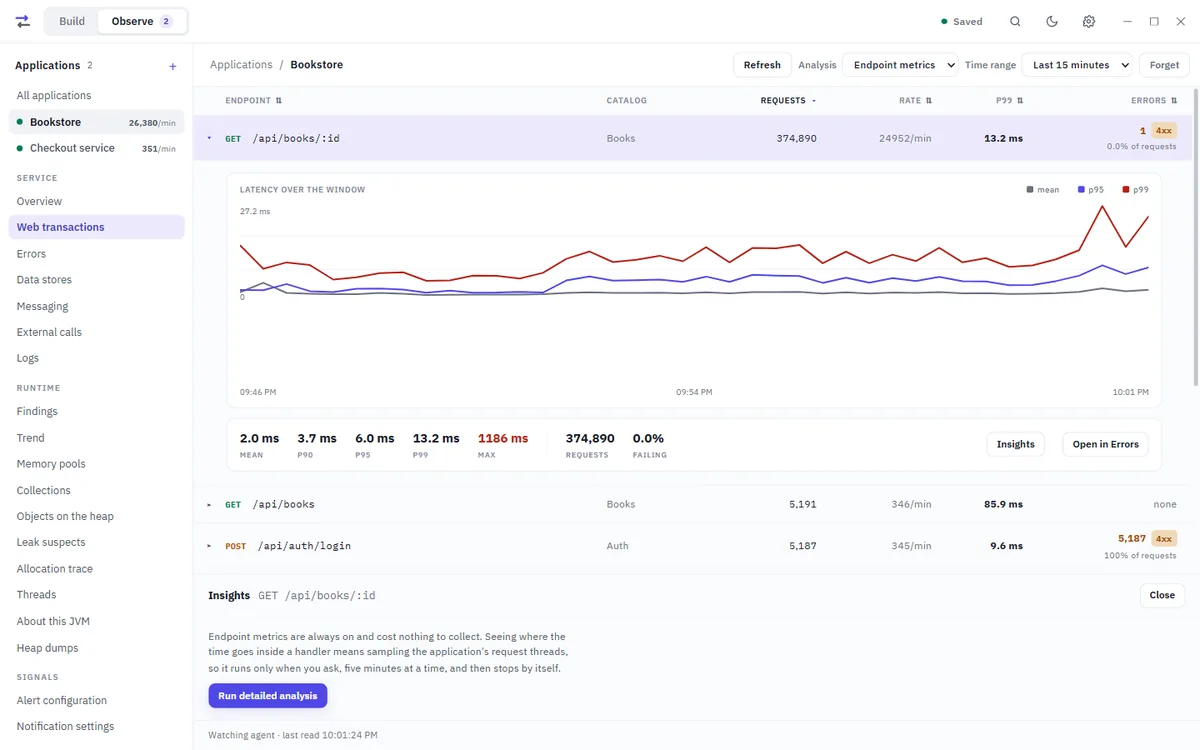
Dispatch Studio in Observe: web transactions for a bookstore service, the busiest endpoint opened to its latency over the window and its percentiles, and an Insights panel breaking GET /api/books/:id down into BookController#get, ViewCache#get, ViewEvents#published and two calls into ViewStatsRepository, from 257 samples.
Web transactions for a running Spring Boot service, with Insights open on one endpoint: where the time goes inside the handler, method by method.
Build

An API workspace that starts from your code

Scan a source tree into catalogs, send any protocol, keep secrets in the OS keystore, and commit suites to your repository.

  • Scan a project
  • Import
  • Catalogs
  • Environments
  • Suites
  • Fake API
  • API documentation
  • History
Load

Load tests made of the same requests

Turn the calls you built into a test plan, run it against an environment that allows it, and read what held and what bent — on a schedule if you like, with rules for what happens after.

  • Test plans
  • Passes when
  • Schedules
  • After the run
  • Compare runs
  • PDF and Excel reports
Observe

A JVM monitor behind the same requests

One -javaagent flag on the service and the screens fill in: per-endpoint percentiles, the JDBC and broker calls behind them, the log, the live JVM, and heap dumps down to the object holding the memory.

  • Overview
  • Web transactions
  • Background jobs
  • Errors
  • Data stores
  • Messaging
  • External calls
  • Logging
  • Runtime
  • Heap dumps
  • Alerts
Workflows

A desktop agent for the steps no API reaches

Write the goal in your own words. The agent works through it with the mouse and keyboard, a stage at a time, each stage with its own limit, and stops the moment you tell it to.

  • Agents
  • Stages and attempts
  • Claude or a local model
  • Run history
AI Ground

Questions answered on your own computer

Ask about your plans, runs, suites and catalogs, and read the answer beside the records it came from. The model runs in Ollama; nothing is sent anywhere.

  • Local model
  • Cited records
  • Make me a plan
  • Forget everything indexed
For a team

An APM server of your own

For staging and production, run the APM server on your own hardware or in your own AWS account, and connect everyone's Studio to it.

  • Docker Compose
  • systemd
  • One EC2 instance
  • Multi-AZ on AWS
Build

Start from the code, not from a blank request

Most API tools begin with an empty request and a URL you have to remember. Dispatch reads the routes out of the service's own source and hands you a catalog you can send straight away.

Scan a project

Point it at a folder. Get every endpoint.

No running service and no OpenAPI document: Scan a project reads the controllers, works out the framework, and generates request bodies from the types the handlers take.

LanguageFrameworks
JavaSpring Boot, Play, JAX-RS, Quarkus, Micronaut
.NETASP.NET Core controllers and minimal APIs
GoGin, Echo, Fiber, Chi, Gorilla mux, net/http
PythonFastAPI, Flask, Django
Six screens of Build in turn — what the scan found, the catalogs it makes, a request and its answer, the checks on it, where secrets live, and a suite that passed.
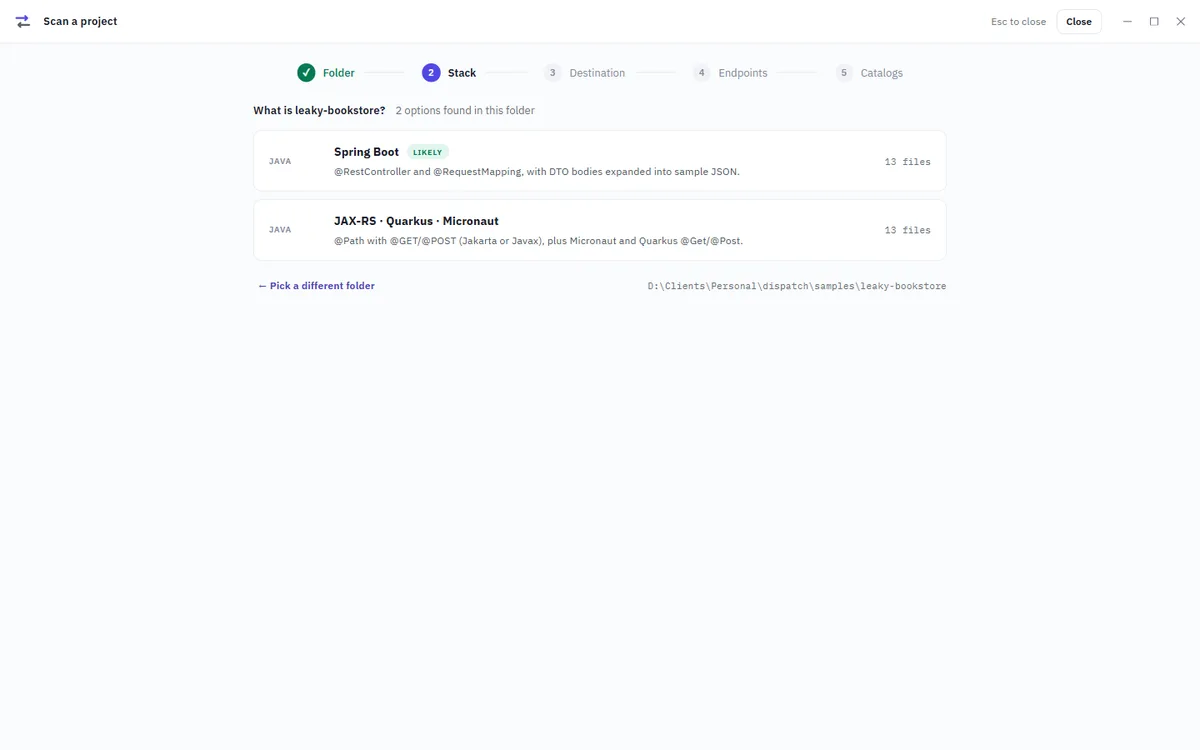
Scan a project asking which of two frameworks found in the folder the service uses, with Spring Boot marked likely.
It asks when the code is ambiguous A folder with both Spring and JAX-RS annotations gets a choice, with the likelier one marked.
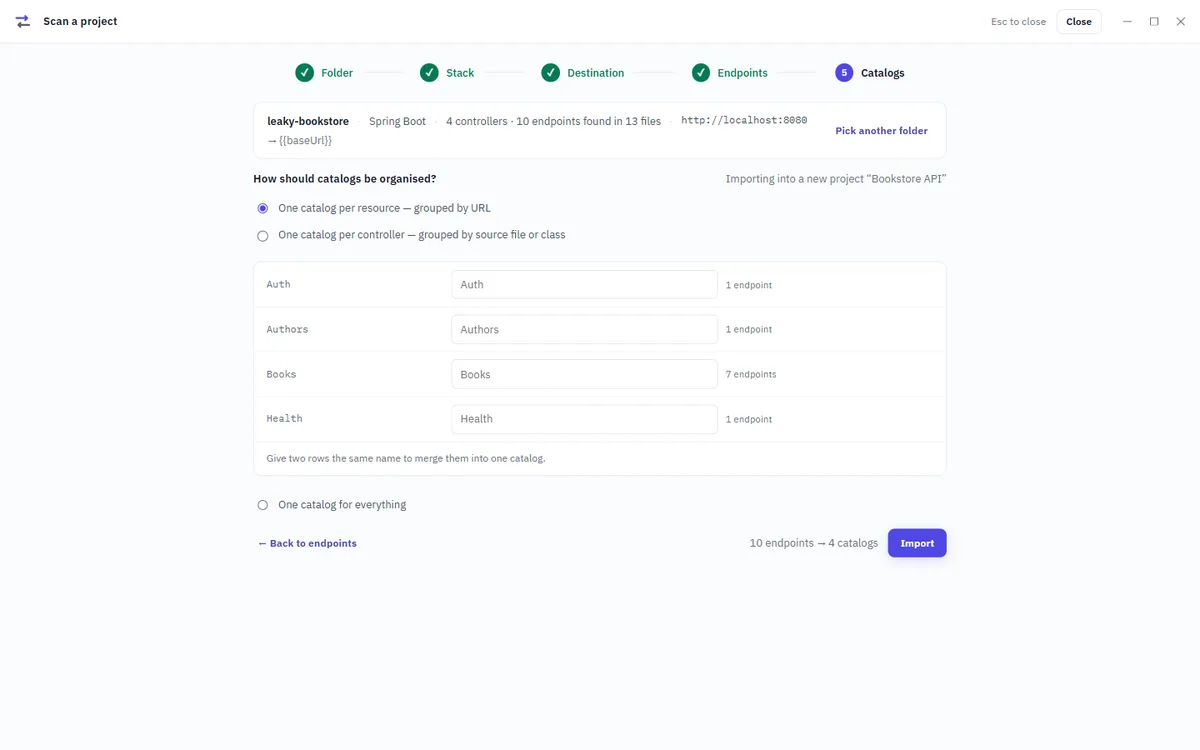
Import options: one catalog per resource grouped by URL, one per controller, or one for everything.
Catalogs the way you think of the API One per resource, one per controller, or one for everything.
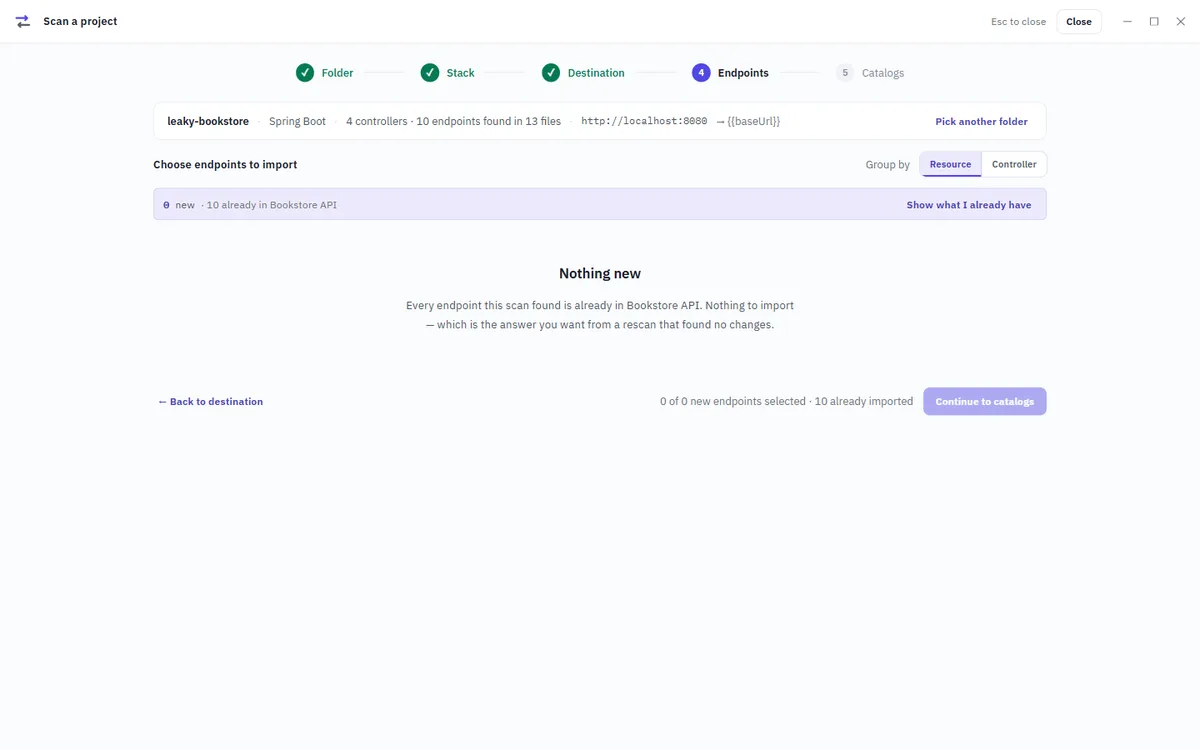
A rescan reporting nothing new: every endpoint it found is already in the project.
A rescan shows what changed Only what is new is offered — here nothing, all ten are already in the project — and the bodies and assertions you added stay put.
Send

Every protocol in one pane

HTTP, GraphQL, WebSocket, server-sent events and gRPC share the same request pane; what changes is the middle. JSON is validated as you type, and the response shows its timing broken into DNS, TCP, TLS, first byte and download.

  • Auth once, on the catalog: bearer, basic, API key or OAuth 2, inherited by every request in it.
  • Path variables apart from query: /books/{id} and ?id= are different things, so a catalog can be re-pointed.
  • The response in five tabs — body, headers, tests, a diff and a console that shows what a script logged. Select a value in the body and Save to variable puts it in an environment.
  • Copy as code in cURL, JavaScript, Python, Go, Java and C#.
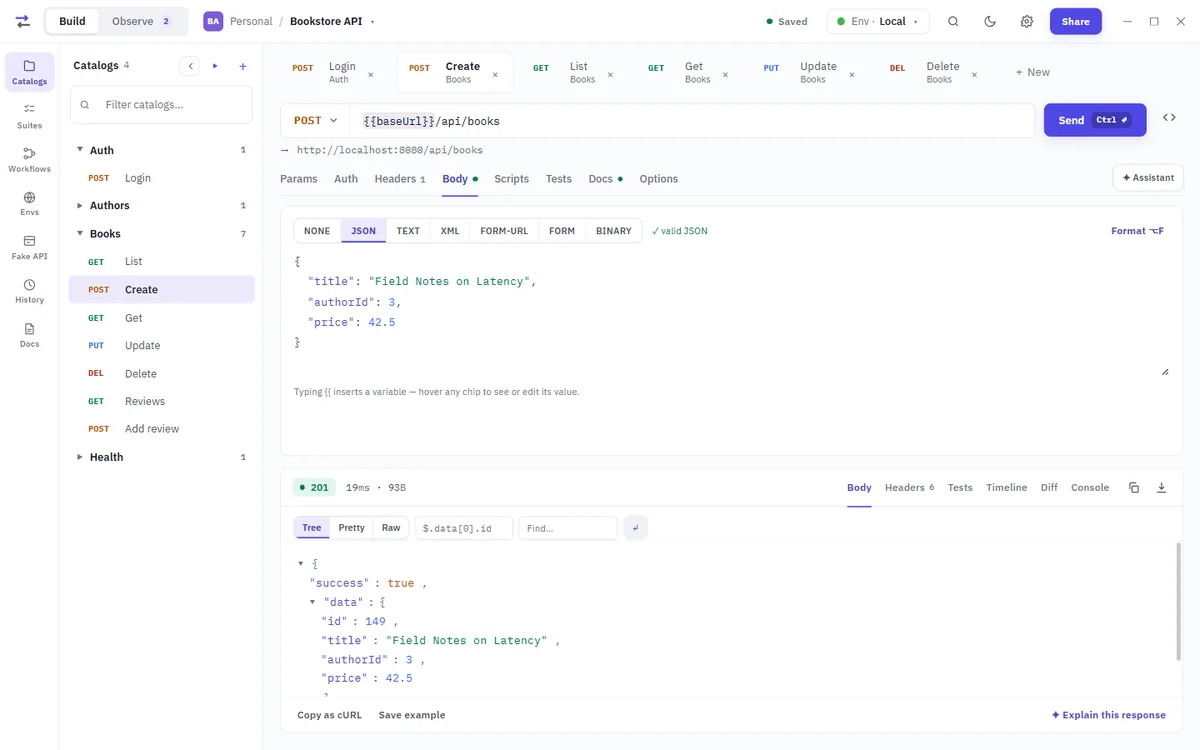
A POST to create a book with a JSON body, answered 201 in 8 ms with the created record shown as a JSON tree.
A POST built from the scan, answered 201 in 8 ms, the response as a tree you can query with JSONPath.
Environments

Secrets stay in the keystore

A variable is {{name}}. Environments belong to the project and carry a colour, so production never looks like local. A variable marked secret lives in Windows Credential Manager — never in the workspace file, a backup, or the clipboard.

Copy as cURL and Copy as code write {{name}} in its place, so what you share keeps its structure and none of its secrets. Each environment also says whether load tests may run against it; none may until you allow it.

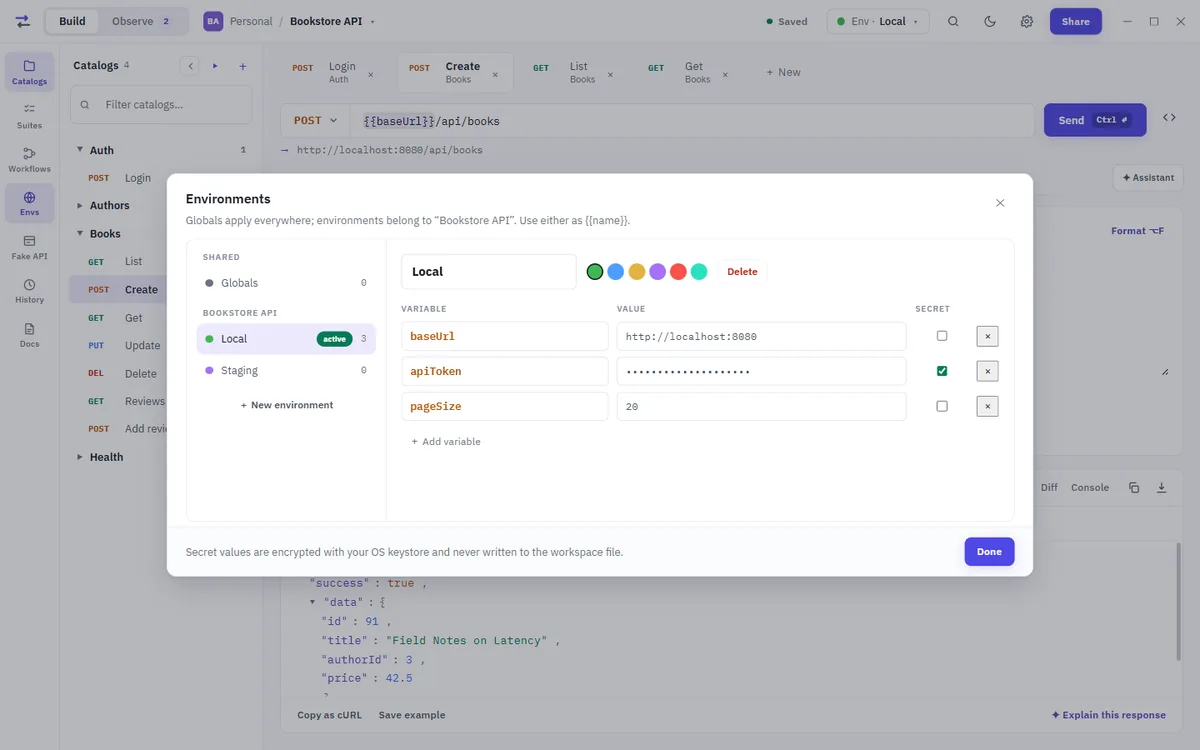
The Environments dialog with Local and Staging environments; password is marked secret and shown masked.
Globals and per-project environments; password is secret and never written to the workspace file.
Tests and chaining

Checks you can read, scripts when you need them

Assertions are declarative — status, time, a header, a JSONPath, the body — each with an operator and a value. Pre-request and post-response scripts handle what assertions cannot say: signing a request, computing a nonce, lifting a token out of a response for the next call.

Chaining is by name: a step in a suite reads the status, a header or the body of any step that already ran, as {{steps.post login.body.$.token}}.

The Tests tab of GET /api/books/:id with three assertions — status code equals 200, the JSONPath $.data.title exists, response time less than 500 ms — and the response's own Tests tab showing all three passed.
Three checks on a book read, and what each one found: 200 == 200, the title exists, 7 < 500.
Suites

Tests that live in your repository

A suite is setup, steps and teardown as a YAML file in your own repository, under .dispatch/suites/. It is reviewed in a pull request and travels with the branch. It is also how requests are put in order: a step reads any earlier step's response by its name, defaults are sent with every step, and Stop at the first failure does what it says. Diagram draws the steps and where each value comes from.

The Chrome extension records a real session — log in, do the thing, stop — and hands back a draft you review before it becomes a suite.

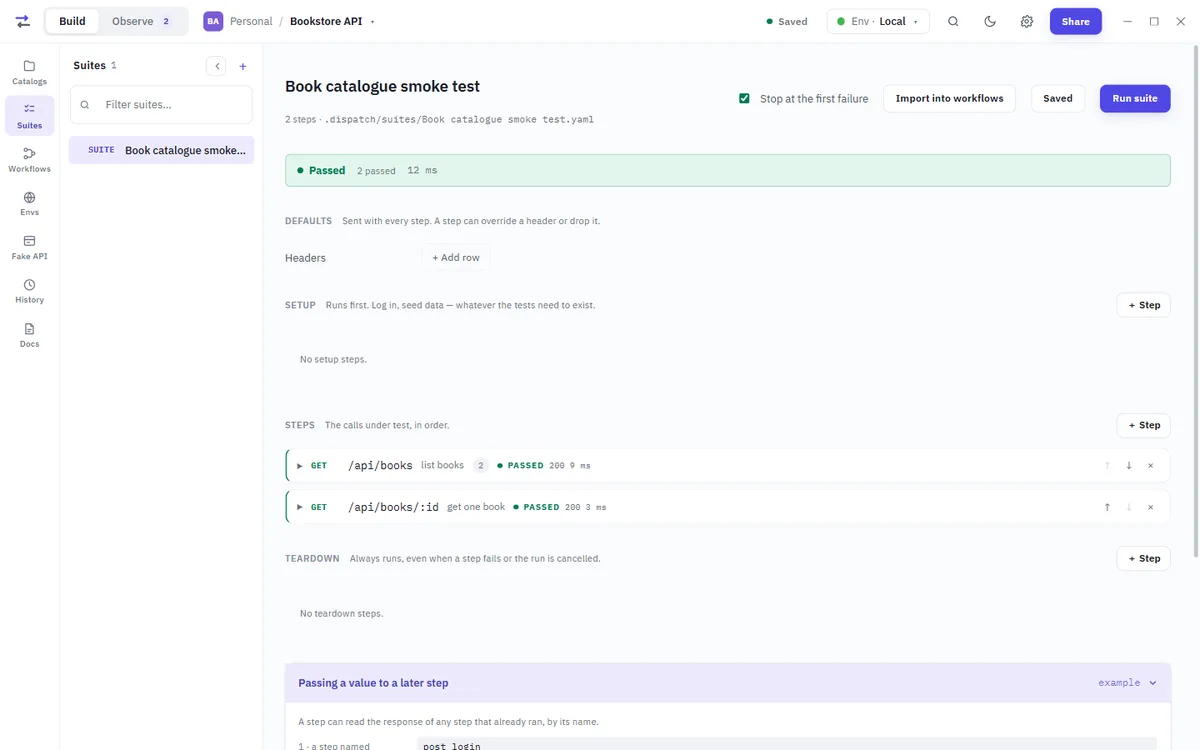
A suite named Book catalogue smoke test with two steps, both passed in 16 ms, stored as a YAML file under .dispatch/suites.
A two-step smoke test, passed in 16 ms, stored as .dispatch/suites/Book catalogue smoke test.yaml.

Import

An OpenAPI or Swagger document from a URL or a file, a Postman collection, a HAR, or one pasted cURL command — into a catalog you can send straight away.

Fake API

A local server on a port you choose, answering with the responses you recorded, so front-end work is not blocked on a service that does not exist yet. It never leaves your machine.

API documentation

Documentation generated from your catalogs, and copied out as Markdown.

History

Every request you send, with its response, per project, across restarts.

The assistant

Bring your own Anthropic key: the assistant explains a response and suggests tests for it. It asks before anything is sent, and Settings says exactly what it sends and what it holds back.

Command palette

Ctrl K for the rest: scan, import, environments, the Fake API, copying a request as code, generating the documentation, the theme.

Load

Then find out how much it takes

The requests you built are the load test. A plan is a file in the repository beside the suites, it runs only against an environment that allows it, and it ends with a verdict against conditions you set before it started.

Test plans

Five steps, one file

A plan is written in five steps down the side of the editor — The numbers, Once at the start, Main, Passes when and After the run — and saved as .dispatch/load/<name>.yaml. Choose Smoke to ask whether it works at all, or Load to ask whether it holds a busy day, bends, or leaks over hours.

  • The numbers: users at once, ramp-up, a duration or a number of rounds, a pause between calls, and a fixed request rate when you want one.
  • Once at the start runs once for each user — signing in, usually; Main is what each user repeats, in weighted scenarios. Bring in a whole suite or a recording, and give each user values of its own from a CSV or JSON file.
  • Passes when is picked, not typed: a measure, a comparison and a number, such as p95 below 500 ms.
Six screens of Load in turn — the numbers, the calls each user repeats, what counts as passing, the run itself, the runs kept, and the report of every request.
The run

What held, what bent, and what the server saw

A run draws response time as the users ramp up, requests a second and errors, then a table for each API and a verdict against the plan's own conditions. It also says whether this computer kept up: a load generator that cannot keep pace is measuring itself, not your service.

With Observe connected, On the server shows what the application was doing while the run went on.

  • Compare runs, or set one run beside any earlier one. The newest 50 runs of each plan are kept.
  • A report of any run as PDF, as an Excel workbook — summary, pass conditions, each API, over time, first failures — or as HTML.
  • Requests to read one by one: the first 500 of a run, and up to 500 failures.
A finished run of Browse the catalogue: response time as 20 users ramped up over 28 seconds against a p95 limit of 500 ms, requests a second, errors at 0 per cent, and a table for each API with GET /api/books/{{bookId}} marked slowest.
10,049 requests from 20 users over two and a half minutes, passed: p95 9 ms, no errors, and the slowest API marked.

Safe by default

A plan is pinned to one environment, and that environment must allow load tests. One named like production asks for its name to be typed before every run, and is never run on a schedule.

On a schedule

Every day, or on the days you choose, at a set time. The computer is kept awake from ten minutes before until the run ends. Studio has to be open — minimised is fine — and a missed run is written into the list rather than run late.

After the run

Rules such as if the run fails, notify me, or if p95 is worse than last run, run an agent with the run's figures filled in. Each run's report can be saved as PDF or Excel into one folder for passed runs and another for failed ones.

Observe

Then switch to Observe

The request you just sent and the database call it caused are the same event. Reading them in two tools means correlating by timestamp and hope — so the monitor is in the same window, behind the same requests. How it connects

Web transactions

Percentiles that keep the tail

Every endpoint's throughput and latency — p90, p95, p99 and the worst call — from histograms recorded per call inside the JVM and summed, never averaged across a window. The tail survives the trip to the desktop. Open an endpoint for its own history, with every collector stop marked under its latency.

Endpoints the scan found but nobody called are listed too, so No traffic is an answer rather than an absence.

Six screens of Observe in turn — the service, its endpoints, one handler’s own time, the wait for a connection, the collector’s stops, and a dump’s leak suspects.
Detailed analysis

Where the time goes inside a handler — when you ask

Endpoint metrics are always on and cost next to nothing. Seeing inside a handler means sampling the threads serving requests, so it runs only when someone asks, for five minutes, and stops on its own.

The Insights panel for GET /api/books/:id offering to run detailed analysis for five minutes.
Insights offers the sampling; nothing is sampled until someone presses the button.
Several applications

One receiver, every service

Each application registers with its own key and reports on its own. Switch between them in the Observe column; each keeps its own history, errors and log.

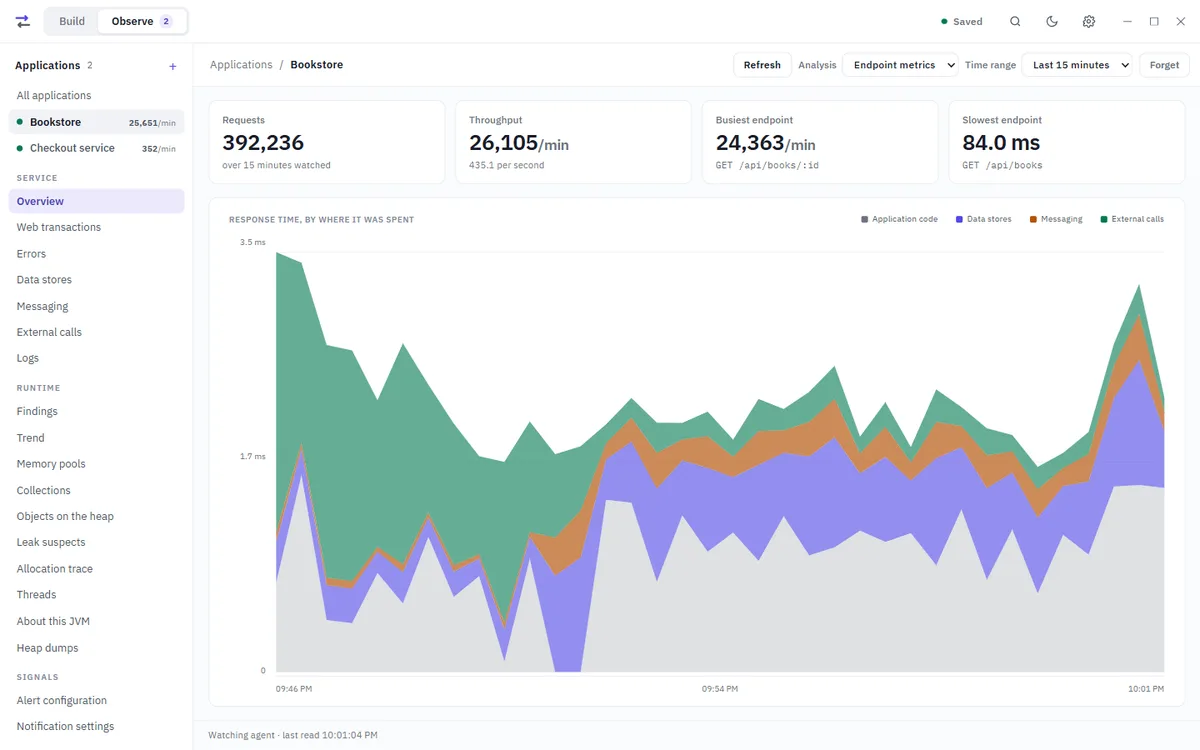
Observe with two applications down the left, Bookstore and Course service, and the bookstore's overview: requests, throughput, its busiest and slowest endpoints, and response time split by where it was spent.
Two applications on one receiver; the bookstore is selected.
Runtime

What the process is doing right now

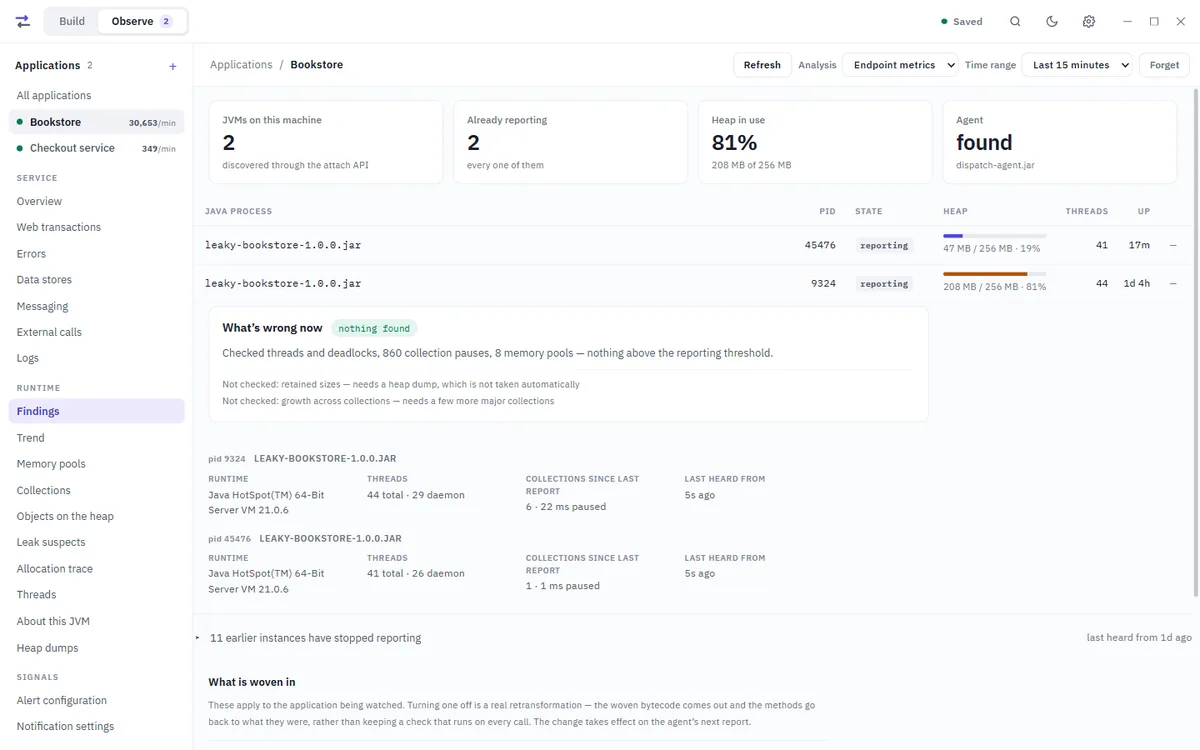
The Runtime screens read the JVM behind the traffic. Findings opens on what is wrong now — threads deadlocked, a heap that is not coming back down, old collections costing more than young ones, a pool nearly full — each one linked to the screen that shows it.

  • Collections: every stop, newest first, with the median, the 95th and 99th percentiles and the longest. A concurrent cycle runs beside the application, so it is counted as a cycle, not a stop.
  • Threads: thread dumps, or three of them five seconds apart to find the ones that are stuck, with saturated pools and the thread holding a lock the others wait on.
  • Memory pools, Leak suspects, Allocation trace and a five-minute CPU profile. The agent can be attached to a JVM already running on this machine.
Observe's Findings for the bookstore: the instance reporting with 161 MB of its 228 MB heap in use, and What's wrong now with two findings — old collections costing more than young ones, and a heap that is not coming back down — each linked to the screen that shows it.
Findings for the bookstore: two findings, each linked to the screen that shows it, and the one check that could not run without a heap dump.
Heap dumps

Who is holding the memory, and why it is still alive

Open an .hprof file, or send one straight from Objects on the heap, and the APM server analyses it — the parsing happens there, not on your desktop. The Dominator tree shows what each object owns: what only it keeps alive, biggest first, where retained is what would be freed if it went.

Why is it alive? walks the path from a GC root to the object, field by field, with weak, soft and phantom references left out unless you ask for them, the root's kind spelled out — a local variable on a thread's stack, a class the JVM itself keeps loaded — and any static field on the way named. Compare sets a dump beside an earlier one: what grew, where the growth is held, and what shrank.

  • Overview
  • Leak suspects
  • Dominator tree
  • Biggest objects
  • Classes
  • Loaders
  • Off-heap
  • Configuration
  • Compare
  • Inspections
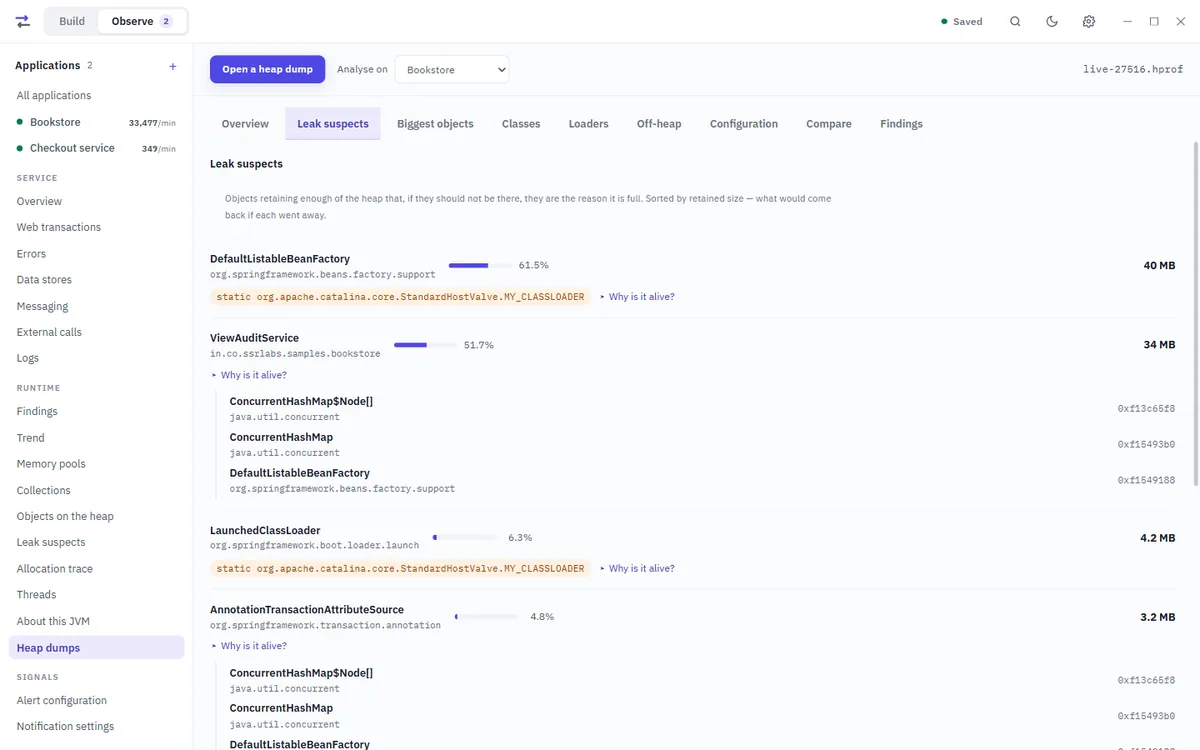
Leak suspects in a heap dump of the bookstore: ViewAuditService retaining 85.6 per cent, 292 MB, most of it in 72,096 view records, then H2's page map and Spring's bean factory, each with a Why is it alive link.
Leak suspects in a dump of the bookstore, each with the path that keeps it alive.

Alerts

Rules on what matters — what to watch, the measure, the threshold, the window it is measured over, and how many checks in a row confirm it — delivered to an email list or PagerDuty, each target checked with a test send. A firing alert can be silenced for an hour.

Hosts

An application on several hosts reads as one, or host by host. The Overview's By host table shows each instance's traffic, heap, CPU and last report; one that stopped reporting stays listed, greyed, for 30 days so its logs can still be read.

What is woven in

Data stores, messaging and external calls can each be switched off while the JVM runs: the woven bytecode comes out and the methods go back to what they were.

A worked example

Five screens, one leak

Every number here came off a real service — a Spring Boot bookstore on a heap of a few hundred megabytes, with an audit cache deliberately left switched on, under steady traffic for about twenty minutes. This is the path the screens walk you down.

STEP 01 Web transactions

The average is fine. The worst case is not.

GET /api/books/:id answers in under 60 ms ninety-five times out of a hundred. Its slowest call took 6.7 seconds — more than a hundred times its own p95. A mean would have hidden it completely.

GET /api/books/:id  ·  7,356 requests
mean45.3 ms
p9556.6 ms
p99430 ms
max6,723 ms
errorsnone
Web transactions with GET /api/books/:id open: its latency over the window, with collector stops marked beneath it and a p99 peak near half a second, and a maximum of 6,723 ms in red beside a p95 of 56.6 ms.
STEP 02 Data stores

It was not the query. It was waiting.

Every statement stayed under 15 ms at the 99th percentile. Connection acquisition is its own row: normally it takes 10 microseconds, and once it took 2.39 seconds — a thread waiting for the pool while the threads holding its connections could not run. The row also says where it was called from: 1.16 acquisitions per GET /api/books/:id, one request holding more than one connection.

H2 · acquire a connection  ·  16,879 calls
p500.01 ms
p990.11 ms
max2,388 ms
per GET /api/books/:id1.16
Data stores with the acquire a connection row open: a median of 0.01 ms and a maximum of 2,388 ms, and Called by attributing it to GET /api/books/:id at 1.16 a request and GET /api/books at 1.00.
STEP 03 Runtime → Collections

Seven collections cost more than a hundred and sixteen.

A pool stalls when the threads holding connections are stopped. Seven old-generation pauses took 0.9 s — 134 ms each; all 116 young collections together took 0.6 s, 5 ms each. Old-generation collections that keep arriving are not a tuning problem — something is surviving them.

PS MarkSweep · old generation7 pauses · 0.9 s
PS Scavenge · young generation116 pauses · 0.6 s
worst single pause201 ms
Collections by collector: PS MarkSweep, the old generation, 7 collections and 0.9 s stopped, 134 ms each; PS Scavenge, the young generation, 116 collections and 0.6 s, 5 ms each; and how long the stops were, with the worst at 201 ms.
STEP 04 Runtime → Leak suspects

What survived: 90 MB of it.

After each major collection the agent takes a class histogram of what is left. Over eleven minutes byte[] gained 90 MB while the number of arrays fell by 198,330 — so the ones being kept are the large ones, and 119 MB of them are still on the heap. Retained, not churn: something is keeping a copy of each.

byte[] · growth over the window+90 MB
still on the heap119 MB · 117,422 arrays
grew after4 of 6 collections
What keeps surviving, from 7 samples over 11 minutes: byte[] the worst offender at 500 MB an hour, 119 MB still on the heap after growing 90 MB, and grown after 4 of 6 collections, well ahead of java.lang.reflect.Method and the rest.
STEP 05 Heap dumps → Dominator tree

byte[] is not the culprit. This is.

A histogram can only ever say byte[]. Retained size says who would free it: walk the dominator tree and one application object holds 85.6% of the reachable heap — a Spring singleton with an unbounded list of view records, each keeping a copy of the page it served.

ViewAuditService · retained292 MB · 85.6 %
held throughArrayList → Object[] · 72,096 records
The dominator tree of a bookstore heap dump: ViewAuditService retaining 292 MB with a shallow size of 32 bytes, through an ArrayList and an Object[] that owns 72,096 ViewAuditService$ViewRecord entries of 4.1 KB each.
Reference

Twelve screens, twelve questions

Each answers something people ask out loud during an incident. Observe groups them the same way, in two rows above the screen: what the service did, the runtime that did it, and what wakes somebody up.

Overview
Where is the time going, minute by minute?
Request time split across data stores, messaging, external and the application itself, and host by host.
Web transactions
Which endpoint is slow, and how slow at the tail?
Throughput and p90–p99 per endpoint, from summed histograms.
Background jobs
What is running that is not a request?
Schedulers and listeners, each with what its runs spend their time on.
Errors
What is failing, and is it our fault or theirs?
Ranked by severity before volume; red for 5xx, amber for client mistakes.
Data stores
Which query, how often, and called from where?
Every JDBC statement, Redis command and connection-pool wait.
Messaging
Are we keeping up with the queue?
Publish and consume timed apart: RabbitMQ, Kafka, JMS and SQS verified.
External calls
Whose service is making us slow?
Outbound HTTP by host, with its own percentiles.
Logs
What did it say while that was happening?
Streamed and searchable, with stack traces, the request each line belongs to, and the lines either side.
Runtime
What is this process doing right now?
Findings, trend, memory pools, collections, threads, leak suspects, allocations and a CPU profile.
Heap dumps
Who is holding the memory?
Dominator tree, leak suspects and the path from a GC root, analysed on the APM server.
Alert configuration
When should somebody be told?
Rules, the alerts they raised, and their history.
Notification settings
Who hears about it?
Email lists and PagerDuty, each with a test send.
Workflows

An agent for the steps no API reaches

Some work only happens in a window, in a desktop program with no API. An agent in Workflows is given the goal in your words and does it with the mouse and keyboard, a stage at a time, on Claude or on a model running on your own computer.

Agents

Write the goal. Check the stages. Press Run.

An agent is a goal — with {{values}} you fill in at each run — and the stages it takes to get there, generated from the goal or written by hand. Each stage has its own limit of attempts, can open a program before it starts, and says whether it needs the model at all. The stages, values, attachments and model are checked first, and a run does not start until every check passes.

  • Claude Sonnet 5 or Opus 5 on the assistant's key, with a consent of its own that lists what is sent; or a local model through Ollama, where nothing leaves the machine.
  • What each stage cost: attempts, tokens read and written, and the price, with the costliest stage marked. Analyse run suggests changes, each with a button to apply it.
  • An output file that Studio writes, never the model, and never over one that is already there.
Six screens of one agent — its goal, its stages, its model and what is sent, the file it writes, when it runs, and its history.
A worked example

The log noticed it. The agent did the rest.

Observe can collect an application’s warnings and errors every few hours into a file of their own. When that window held something, it starts a desktop agent and hands it the figures: how many errors, which application, how far back it looked, and where the file is.

The agent is one you wrote. These six stages open a terminal in the checkout, give Claude Code the digest, wait while it reads the code the digest points at, ask for the tests that cover what it changed, and ask it to raise a pull request — then write the address of that pull request to a file.

  • Only when there was something: a quiet night starts nothing, so the agent’s history stays worth reading.
  • It collects whether or not the screen is open, as long as Studio is running. The clock is counted from the last collection, so the windows meet end to end with no gap.
  • The digest fills the agent’s {{variables}} — {{file}}, {{errors}}, {{application}}, {{hours}} — and a name that is not one of its figures is left as written, so a typo shows up in the log rather than as an empty string.
  • Every stage has its own attempt limit, and a run stops at the stage that spends them.
Observe's Scheduling tab for the Bookstore: one schedule reading Every 2 hours, since the last one, on, next in 1 hour 51 minutes, writing into D:\Reports\digests and then running the agent Fix what the log digest found.
Every two hours, looking back two hours — and when the window held a warning or an error, it runs the agent named beside it.
What it was told to do

Six stages, in your own words

A stage is a sentence. The agent works through them in order, and you can untick one to skip it without deleting it. Nothing here is a macro: each stage is read by the model, which looks at the screen and decides what to do next.

Which is also why the panel at the foot of the screen says what it says. While it runs, the agent has your real mouse and keyboard — so it tells you to close anything private first, and gives you two ways to stop it before you ever press Run.

The agent Fix what the log digest found, with six stages: open a terminal in the checkout, start Claude Code and give it the digest, let it read the code and write a fix, ask it to run the tests, ask it to commit on a branch and raise a pull request, and write the pull request's address to the output file.
The stages of Fix what the log digest found, each with its own limit on attempts.

Rules it works to

The model is told that text on the screen is not an instruction, never to type a password, and to stop before it sends, submits, buys, deletes or changes a setting.

You can always stop it

While it runs, an amber frame goes round the screen. Press Ctrl+Alt+Q or push the mouse into the top-left corner, and it stops before its next action.

Runs you can go back to

Each run keeps its log and the last screen of every attempt, for 14 days and up to 50 runs an agent. An agent has no clock of its own: you press Run, or something else starts it — a Load rule after a run, or a log digest that found warnings.

AI Ground

Ask about your own work, on your own computer

AI Ground answers questions from what Dispatch already holds: your test plans and their runs, your suites and what they did, and the endpoints in your catalogs. The model runs in Ollama on your computer, and nothing is sent anywhere.

Answers with sources

Every answer beside the records it came from

A question is matched against the records first; then a local model reads the best of them and answers, citing each one as [1]. The records it read are listed beside the answer, and one is marked as used only if the answer cited it, so a claim with nothing behind it shows as one.

With no model set up, the same question returns the matching records, ranked. Observe's readings and response bodies come in a later version.

  • Ask about the open project, every project, load runs only, or the last day.
  • Which endpoints does nothing test? is answered from the catalogs, the suites and the plans together.
  • A quick model first: it offers the smallest model you have that is not a reasoning, vision or embedding model, because on a computer without a graphics card a model that thinks before it answers can take minutes.
AI Ground answering Which endpoints does nothing test? with eight endpoints, each cited to the catalog record it came from, and What it read beside the answer listing the seven records it was given.
Answered by llama3.2:3b on this computer in 73 seconds, from the four catalogs and the suite’s own runs.

Make me a plan

Ask for a load test plan and you get a plan to read, not a paragraph: every call is one the project really has, runaway numbers are brought within limits, the environment is Dispatch's own, and nothing is written until you press Create the plan.

Nothing leaves the machine

Ollama on 127.0.0.1, and nothing else. The Anthropic key the assistant uses is never used here.

What it keeps

A record of each run, plan, suite and catalog, in Dispatch's own folder on this computer. Credentials and secret values are taken out before anything is written, and Forget everything indexed clears the lot.

Supported

What it reads, and what it watches

Every version below is one the integration has actually been run against; a range was run version by version, on every Java from 8 to 26 that the library itself supports. Where something is supported in the code but has not yet met a live system, the table says so.

Verified run end to end against a real service, at the version shown Tested covered by the test suite RecognisedInstrumented supported in the code, not yet run against a live system

Scan a projectRoutes read straight from the source

Java and Scala
Spring Boot@RestController and @RequestMapping, bodies from the DTOsVerifiedSpring Boot 3.3.4 · Java 21
JAX-RS and Jakarta REST@Path with @GET and @POST, jakarta.ws.rs or javax.ws.rsVerifiedjakarta.ws.rs
Quarkus, Micronaut@Path, and Micronaut’s @Get and @PostRecognised
Play Frameworkconf/routesVerifiedScala 2.13
C#
ASP.NET Core controllers[ApiController] with attribute routesVerified.NET 8
ASP.NET Core minimal APIsMapGet, MapPost and the restTested
Go
net/httpIncluding Go 1.22 method patternsVerifiedGo 1.23
Gin, Chi, Gorilla muxTested
Echo, FiberRecognised
Python
FastAPIVerifiedFastAPI 0.115 · Pydantic 2.9
DjangoTested
FlaskRecognised

Import, send and export

Import
OpenAPIFrom a URL or a file3.0 · 3.1
Swagger2.0
Postman Collectionv2.1
HAR1.2
cURLOne command, pasted
Send
HTTP, GraphQL, WebSocket, server-sent events, gRPCGraphQL with introspection; gRPC from a .proto
Copy as code
cURL, JavaScript, Python, Go, Java, C#fetch and axios · requests · net/http · java.net.http · HttpClient

The monitorOne agent in the JVM; web transactions from any service’s metrics

Runtime
Java 8 and laterThe agent is Java 8 bytecode, with no dependencies of its ownVerifiedJDK 8 · 11 · 17 · 21 · 26HotSpot
Web transactions
Spring Boot ActuatorMicrometer’s http.server.requests; percentiles need micrometer-registry-prometheusVerifiedSpring Boot 3.3.4 · Micrometer 1.13.4
Any service with a Prometheus request histogramhttp_request_duration_seconds, as Go and Python services publish itTestedGo 1.23 · client_golang 1.19
OpenTelemetry HTTP metricshttp.server.request.durationTested
Data stores
JDBC, any driverPostgreSQL, MySQL, MariaDB, SQL Server and Oracle named from the driverVerifiedH2 1.4.200 – 2.4.240PostgreSQL 42.2.5 – 42.7.13
HikariCPConnection waits and pool useVerified3.4.5 – 7.0.2
Redis through LettuceCommands, memory and hit rate; the async and reactive APIs, Jedis and Redisson not yetVerifiedLettuce 5.0.5 – 7.7.0
MongoDB Java driverThrough the driver’s own command and pool listenersVerifiedsync driver 3.12.14 – 5.11.1
Messaging
RabbitMQamqp-client publish, Spring AMQP listeners; consuming with the plain client not yetVerifiedamqp-client 4.0.3 – 5.35.0Spring AMQP 2.2 – 4.1
Apache KafkaProducer sends, Spring Kafka listeners, consumer lag; a plain consumer’s poll and Kafka Streams not yetVerifiedkafka-clients 2.4.1 – 4.3.1Spring Kafka 2.5 – 4.1
JMS and Jakarta Messagingjavax.jms and jakarta.jms; ActiveMQ, Artemis, IBM MQ, Solace and TIBCO EMS named; MessageListener and JMSContext not yetVerifiedActiveMQ 5.15 – 5.19 · 6.0 – 6.3Artemis 2.19 – 2.57
Amazon SQSAWS SDK for Java 2.x, the synchronous client; the async client not yetVerifiedAWS SDK 2.17 – 2.54
Outbound HTTP
Spring RestTemplateVerifiedSpring Framework 4.3 – 7.0
Apache HttpClient4.x, and 5.x classicVerified4.3.6 – 4.5.145.0.4 – 5.6.1
OkHttp3.x, 4.x and 5.xVerified3.12.13 – 4.12.05.1.0 – 5.5.0
JDK HttpClient, HttpURLConnection, WebClientAnd the async clients of OkHttp and ApacheNot yet
Logs
LogbackLevel, logger, thread, context and stack traces as fieldsVerified1.1.11 – 1.5.34
Anything printing to standard outputKept as text, the level read from the lineTested
Log4j2, java.util.loggingNot yet
How it connects

The agent reports. The receiver remembers.

The agent is the only piece inside your process. It dials out — nothing in your application's network has to accept a connection — and the receiver keeps history on disk, so the screens still have yesterday in them after the service has gone.

YOUR SERVICE RECEIVER DESKTOP Application JVM dispatch-agent.jar timed calls · log tap heap · threads · collections APM receiver applications · keys log store · leak radar heap-dump analysis Dispatch Studio Observe: APM and Heap beside the API workspace requests · suites · load history on disk restored when it restarts POST every 10 s GET on refresh

Credentials never leave the JVM

Flags, system properties and log-context values whose names read like credentials are masked inside the application, before anything is reported.

Nothing to open in your network

The agent makes outbound calls only. The receiver attaches to a JVM only when you explicitly ask it to.

Nothing leaves your machine

Your machine talks to your receiver. No account, no cloud, no telemetry. Two things send anything further, both started by you and both asking first: the assistant, and a desktop agent on a Claude model. AI Ground never does.

APM server

For a team, a server of your own

On one developer's machine the receiver runs beside Studio. For staging and production, a team runs the APM server on its own hardware or in its own AWS account, and everyone's Studio connects to it. Nothing leaves your network.

What it needs

Operating systemLinux, x86-64 or ARM64
RuntimeJava 21, or the container images
Up to 100 JVMsone machine: 4 vCPU, 16 GB, 250 GB SSD
Certificateone your JVMs already trust

Three ways to run it

  • One machine of your own, with Docker Compose or systemd
  • One EC2 instance in your AWS account
  • Across availability zones on AWS, behind a load balancer

The setup guide, step by step

Setup

One flag, then as much or as little as you want

Attach the agent

The agent targets Java 8 bytecode, so it attaches to anything from 8 upward — at startup, or, when the receiver is on the same machine, to a JVM that is already running, from the Runtime screens.

java -javaagent:/opt/dispatch-agent.jar=\
  dispatch.apm.agent.report.url=http://127.0.0.1:8090,\
  dispatch.apm.agent.report.key=dsk_… \
  -jar your-service.jar

Turn features on and off

Every setting is optional, in the agent argument, a system property, an environment variable or a properties file.

# /etc/dispatch-apm-agent.conf
dispatch.apm.agent.datastore.enabled=true
dispatch.apm.agent.messaging.enabled=false
dispatch.apm.agent.external.enabled=true

# the Logs screen
dispatch.apm.agent.logs.enabled=true

# leak radar
dispatch.apm.agent.radar.interval.minutes=15
Contact

Get in touch

Questions about running Studio, about the APM server across shared environments, or about anything on this page. It reaches one person, and he answers.

So a reply has somewhere to go, if your mail app does not fill it in.
Nothing is sent from this page — your own mail app opens with the message ready, and you press send.
Requirements

Dispatch Studio for Windows

One installer with its own runtime. It opens on a sample project, so there is something to send before you have scanned anything of your own.

DesktopWindows 10 or 11, x64
Monitored servicesJava 8 and up, HotSpot
ReceiverJava 21, on any host you choose
APM server, for teamsLinux and Java 21, or your AWS account
Local model, optionalOllama, on the same computer
AccountNone